Room Dashboard
The Room Dashboard gives the user more information about the room’s status and how it is performing. You can see the last result date, the overall status of the room, and the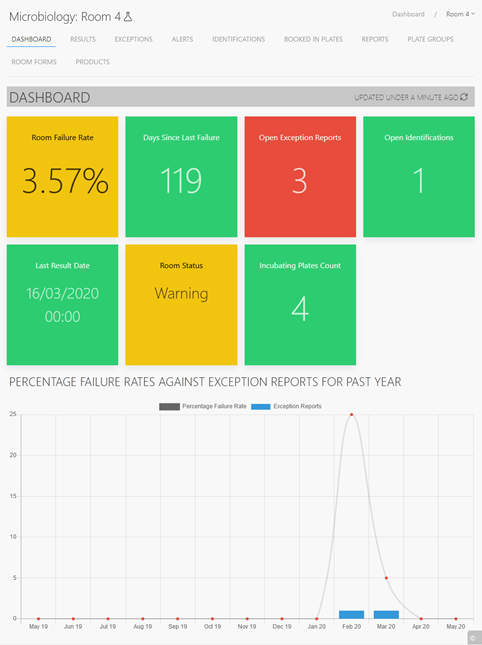 number of plates in the incubator, along with the data points that were also present on the main dashboard.
Below the data squares is a graph plotting the number of exception reports (bar chart) against the percentage failure rate of the room (line graph).
This view also reveals the Room menu towards the top. From here you can see the results from this room as well as exception, alerts, identifications, booked in plates, reports, plate groups, room forms, and any manufacturing products if the room is a manufacturing room.
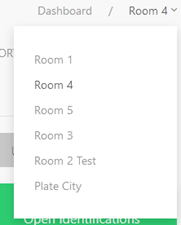
At the very top is the name of the unit the room is in followed by the name of the current room as well. To the right is the path to this room, from here you can quickly change to another room in the same unit using the dropdown next to the current room name.